
AVHRR

PLEASE NOTE THE FOLLOWING REGARDING AVHRR DATA:
The Daily News Report of the NOAA Office of Satellite Operations reported on March 22, 2004:
“On March 20 at ~1850Z, the NOAA-16 AVHRR scan motor current again started to surge to pegged levels. This situation was very similar to that shown earlier the previous week where it would surge for a short time, then returned to nominal then surge again. Imagery was "bar coded" through much of the weekend, until ~0515Z this morning, when imagery began to clear up. Imagery is now intermittently "bar coded".”
Due to these problems the daily, weekly or monthly NOAA16-AVHRR products as NDVI, LST or SST cannot be delivered by DFD in the moment. Facing the “bar coded” images of NOAA16-AVHRR which occurred first in September 2003, continued in January 2004 for the second time and appeared now again, DFD has decided
- to stop the reception of NOAA16 data on April 6th, 2004
- to start the reception of NOAA17 data on this day
- to modify the production of all former NOAA16-AVHRR products to the generation of higher level NOAA17-AVHRR products.
DFD will do the best to minimize the lack of data availability for our customer.
Please remember that NOAA17 is an AM sensor which passes central Europe about 2 hours earlier than NOAA16 (about 10:00 UTC instead of 12:00 UTC for NOAA16).
AVHRR Instrument Characteristics
These image data have been recorded by the "Advanced Very High ResolutionRadiometer (AVHRR)", a sensor operating onboard of the NOAA - POES series (Polar-Orbiting OperationalEnvironmental Satellites; Fig. 1). The NOAA-POES series are regarded as the backbone of the US meteorological program. The current POES series satellites are named simply NOAA-9 through NOAA-17 in order of launch. The program has evolved over several years starting in 1960 with TIROS. The philosophy of NOAA is to maintain at least two operational satellites in complementary orbit. The POES satellites will operate till 2010.
All NOAA-POES satellites have a circular, sun-synchronous polar orbit with a nominal flight height of 833 km. The even numbered satellites cross the equator at local solar times of approximately 7:30 and 19:30, while the odd-numbered satellites cross the equator at local solar times of approximately 2:30 and 14:30.
For further details concerning the NOAA satellites look at the NOAA internet sites ( NOAA - documentation ).
Figure 1: The NOAA satellite with AVHRR on board
The AVHRR flown aboard TIROS-N, NOAA-6, NOAA-8, NOAA-10 and NOAA-12 worked with four spectral channels (AVHRR/1), the AVHRR aboard NOAA-7, NOAA-9, NOAA-11and NOAA-13 and NOAA-14 is operating in five channels (AVHRR/2). With the operation of NOAA15, a new version of the AVHRR (called AVHRR/3) is in orbit (for further details concerning the AVHRR sensors see: sensor information).
The AVHRR/3 is a six channel instrument, with three of the channels located in the visible and near-infrared regions of the spectrum, having effective wavelengths around 0.63µm (channel 1), 0.86µm (channel 2), and 1.6µm (channel 3A for day time operation), while the remaining three are located in the atmospheric window regions in the infrared with effective wavelengths centered around 3.7µm (channel 3B for night time operation), 10.8µm (channel 4), and 11.5µm (channel 5). All subsequent satellites in the series NOAA KLM will have six channels. Another new feature accompanied the AVHRR/3 instruments. For channel 1, 2 and 3A the gain factor is split in order to increase the digital resolution for low albedo ranges from 0% to 25% by a factor of two. The resolution for the range between 25% and 100% is reduced.
Provision has been made for the transmission of five channels in the data format for all older and new satellites. Channel 5 contains a repeat of Channel 4 data, when only four different channels are available (AVHRR/1). Currently, the AVHRR's onboard NOAA-12 , NOAA-15, NOAA-17 and NOAA-18 are in operational mode. AVHRR on board of NOAA-16 severely degraded due to scan motor anomaly. NOAA-13 didn't become operational due to a power failure after launch.
| Name after launch |
Name before launch |
Date of launch |
AVHRR version |
Mode of operation |
| TIROS-N | TIROS-N | October, 1978 | ||
| NOAA-6 | NOAA-A | June 27, 1979 | end of mission: November 11, 1986 | |
| NOAA-7 | NOAA-C | June 23, 1981 | 2 | end of mission: June 7, 1986 |
| NOAA-8 | NOAA-E | March 28, 1983 | 1 | end of mission: October 31, 1985 |
| NOAA-9 | NOAA-F | December 12, 1984 | 2 | end of mission: November 5, 1994 |
| NOAA-10 | NOAA-G | September 17, 1986 | 1 | operational |
| NOAA-11 | NOAA-H | September 24, 1988 | 2 | end of mission: September 13, 1994 |
| NOAA-12 | NOAA-D | May 15, 1991 | 1 | in operation; no generation of value-added products by DFD |
| NOAA-13 | NOAA-I | August, 1993 | failure after launch | |
| NOAA-14 | NOAA-J | December 30, 1994 | 2 | degraded; generation of value-added products was stopped on October 3, 2001 by DFD |
| NOAA-15 | NOAA-K | May 13, 1998 | 3 | in operation; no generation of value-added products by DFD |
| NOAA-16 | NOAA-L | September 21, 2000 | 3 | in operation; no generation of value-added products by DFD |
| NOAA-17 | NOAA-M | June 2002 | 3 | in operation; no generation of value-added products by DFD |
| NOAA-18 | NOAA-N | May 20, 2005 | 3 | in operation; generation of value-added products (NDVI, LST and SST) by DFD ongoing |
NOAA POES Launch Dates
The AVHRR instrument is a cross-track scanning system similar to the former VHRR, but features four (AVHRR/1), five (AVHRR/2) or six (AVHRR/3) spectral channels. The spectral bandwidth (µm) and the "Instantaneous Field of View (IFoV)" of the AVHRR is listed below:
| Channel | TIROS-N | NOAA-6,8,10 | NOAA-7,9,11,12,14 | NOAA-15,16,17,18 | IFoV(mrad) |
| 1 | 0.550- 0.90 µm | 0.580- 0.68 µm | 0.580- 0.68 µm | 0.58 - 0.68 µm | 1.39 |
| 2 | 0.725- 1.10 µm | 0.725- 1.10 µm | 0.725- 1.10 µm | 0.725-1.0 µm | 1.41 |
| 3A | 1.58-1.64 µm | 1.3 | |||
| 3B | 3.550- 3.93 µm | 3.550- 3.93 µm | 3.550- 3.93 µm | 3.55-3.93 µm | 1.51 |
| 4 | 10.500-11.50 µm | 10.500-11.50 µm | 10.300-11.30 µm | 10.3-11.3 µm | 1.41 |
| 5 | Ch4 rep. | Ch4 rep. | 11.500-12.50 µm | 11.5-12.5 µm | 1.30 |
Spectral characteristics of AVHRR sensors
The IFoV of each channel is approximately 1.4 milliradians leading to a resolution at the satellite subpoint of 1.1 km for a nominal altitude of 833 km. The scanning rate of the AVHRR is 360 scans per minute. The time within each scan line of AVHRR data represents IFOV #1.
The analog data output from the sensors is digitized on board the satellite with 10 bit resolution at a rate of 39,936 samples per second per channel. Each sample step corresponds to an angle of scanner rotation of 0.95 milliradians. At this sampling rate, there are 1.362 samples per IFoV. A total of 2048 samples will be obtained per channel per Earth scan, which will span an angle of 55.4 degrees from the nadir (subpoint view).
The IR channels are calibrated in-flight using a view of a stable blackbody and space as references. No in-flight calibration of the visible channels is performed (although the spaceview is available as one reference point). Although these will vary from instrument to instrument, the design goals for the IR channels were an NEdT of 0.12K (@ 300K) and a signal to noise ratio (S/N) of 3:1 @ 0.5% albedo. The calibration of the visible channels 1 and 2 was done using pre-launch calibration coefficients for NOAA-10 and -12 and time-adjusted values for the NOAA-7, NOAA-9 and NOAA-11 AVHRR. For the NOAA-14 AVHRR, pre-flight values were used between January 19, 1995 and November 21, 1995. On July 31, 1995, NOAA NESDIS published new calibration post-launch coefficients which were applied for all products between November 22, 1995 and November 11, 1996.
Since November 12, 1996, the calibration coefficients have been updated once a month by NOAA NESDIS and these updates are implemented in DFD's production chain after availability.
An overview of the operational NOAA-AVHRR processing scheme of DFD is given in Figure 2. After reception of the AVHRR data a pre-processing routine delivers calibrated and auto-navigated data. These level 1 data are used for generating RGB - quicklooks overlayed with coastline and a so called media product which is a subset showing wide parts of Central Europe (“Central Europe”). The level 1 data are also used for generating value-added products such as the “Normalised Difference Vegetation Index” of Europe, the sea surface temperature of European seas and the land surface temperature of Europe representing a day-time or nighttime land surface temperature. For all value-added products different routines as e.g. cloud masking, georeferencing, including land-sea mask and compositing are necessary (level 2 data). The level 2 data are used for deriving daily, weekly and monthly level 3 products which are accessible by the internet (EOWEB)
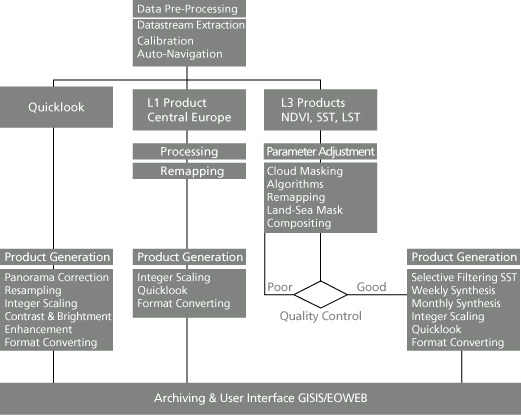
Figure 2: Overview of the NOAA-AVHRR processing scheme for generating operational products like quicklooks, level 1 and level 3 products. All products are available via the user interface GISIS or EOWEB.
Geographical and temporal coverage from DLR's station at Oberpfaffenhofen
The total image size of a pass depends on the time of visibility of the spacecraft and varies from day to day and from pass to pass. A "long" acquisition, e.g. a "central" pass, may contain up to 5600 lines and covers about 7150km in north-south direction. 2048 pixels are digitized for every scan line which results in a pass width of about 3000 km. The geometrical resolution of the instrument is appr. 1.1 km at nadir and is reduced due to the wide swath width and the earth curvature down to ~ 6 km close to the pass edges. The wide scan angle of the AVHRR means that the local time for pixels at the eastern and western edges of the swath can vary by more than an hour. Due to the fact, that the NOAA satellites do not complete an integral number of orbits per day, the same pixel will be imaged at local times varying up to ±50 minutes for successive days, a phenomenon called phasing.
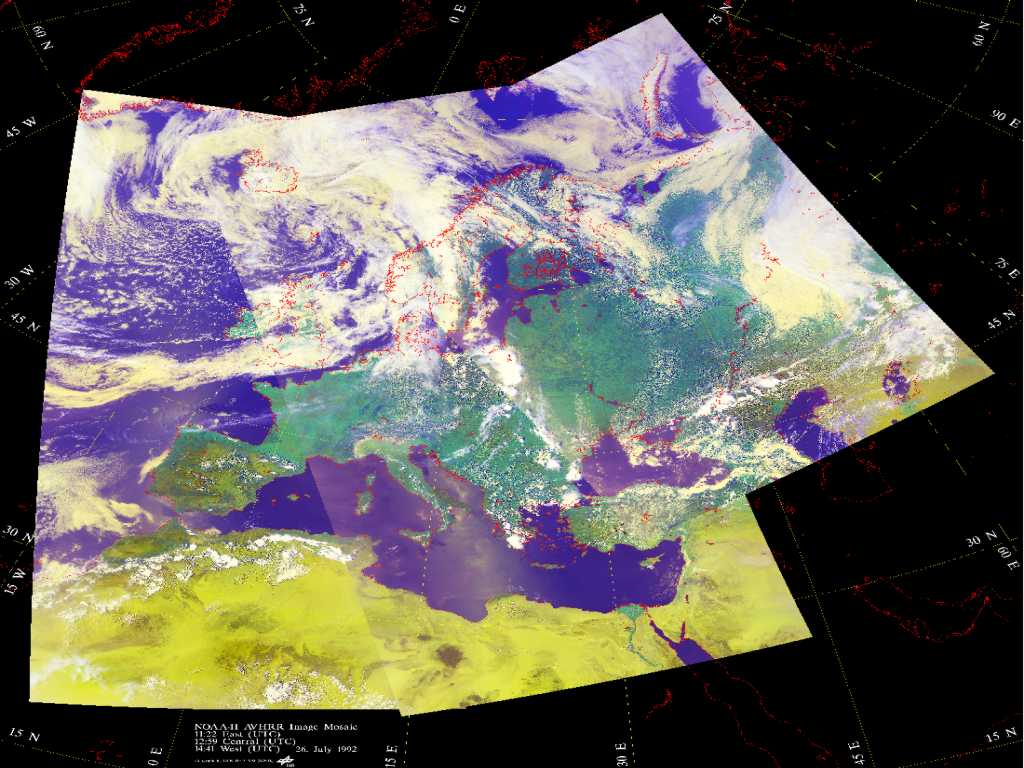
Figure 3: Geographical coverage for AVHRR data reception from Oberpfaffenhofen, Germany
More than 63.000 scenes (as of November 2002) have been received since 1981 at Oberpfaffenhofen covering the station's visibility. Depending on the actual track (eastern, central and western) being received, the scenes cover different areas, reaching from Spitzbergen in the north to the Northern Sahara in the south and from the Central Atlantic in the west to Central Asia in the east (see Fig. 3).
Depending on special user requirements, additional passes can be captured on request!
Digital browse quicklooks and all data can be accessed via EOWEB. Quicklooks after December 7, 1994 show a combination of AVHRR channels 1-2-4 (r-g-b) for daytime data (minimum sun zenith angle as threshold) and a combination of channels 5-4-3 (r-g-b) for nighttime data. The data are re-navigated using actual orbital-elements provided by NOAA ("two-line-elements"), resampled to a nadir ground resolution of ~ 6 km, panorama-corrected against distortions due to the earth curvature, brightness and contrast-enhanced, and superimposed with a coastline (WDB-II) in red. No sun-angle correction is performed, in order to provide the user an "informative" view of the brightness conditions in the solar channels 1 and 2.
For older scenes the quicklooks consist of two bands, channel 2 on the left side and 4 on the right side for daytime data, and channel 3 (left) and channel 4 (right) for nighttime data. All are also resampled, enhanced and panorama-corrected.
Datasets in HRPT formats are stored on different media, older data on HDDT analogue tapes, some on digital CCT. Since 1990 all datasets have been digitised and stored on Jukebox Optical Disks. Users can get data either in a DLR-specific "DFD" format which is containing the complete datastream (AVHRR, TOVS, DCS, etc.) on Magnetic Tape (CCT) or on Exabyte Cassettes as well as raw HRPT and NOAA LAC format.
Subsets of AVHRR acquisitions stored in the ESA-Earthnet SHARP format (Standard-family HRPT Archive Request Product) can also be ordered at the DFD. The AVHRR scenes in SHARP format contain 4 minutes of acquisition, thus 1440 lines. Descriptions are available.
For questions regarding NOAA AVHRR data usage, data formats and acquisition schedules please contact the WDC-Team.