
SEVIRI/APOLLO
Cloud physical parameters over Europe and Africa from MSG/SEVIRI
Cloud physical parameters from SEVIRI at WDC-RSAT
Description:
The APOLLO methodology delivers cloud mask, cloud classification, cloud optical depth, liquid and ice water path, cloud top temperature
and infrared emissivity as cloud parameter products for each Meteosat Second Generation (MSG) SEVIRI pixel in a temporal resolution of
15 minutes during daytime. It was decided to store the parameters cloud mask, cloud coverage and type, cloud top temperature, and cloud
optical thickness.
Additionally, a cloud classification scheme delivers information on
- vertically extended cold, very thick cloud-layers
- thin clouds
- warm and thick water clouds
- multi-layer clouds
- stratiform clouds
Product examples:
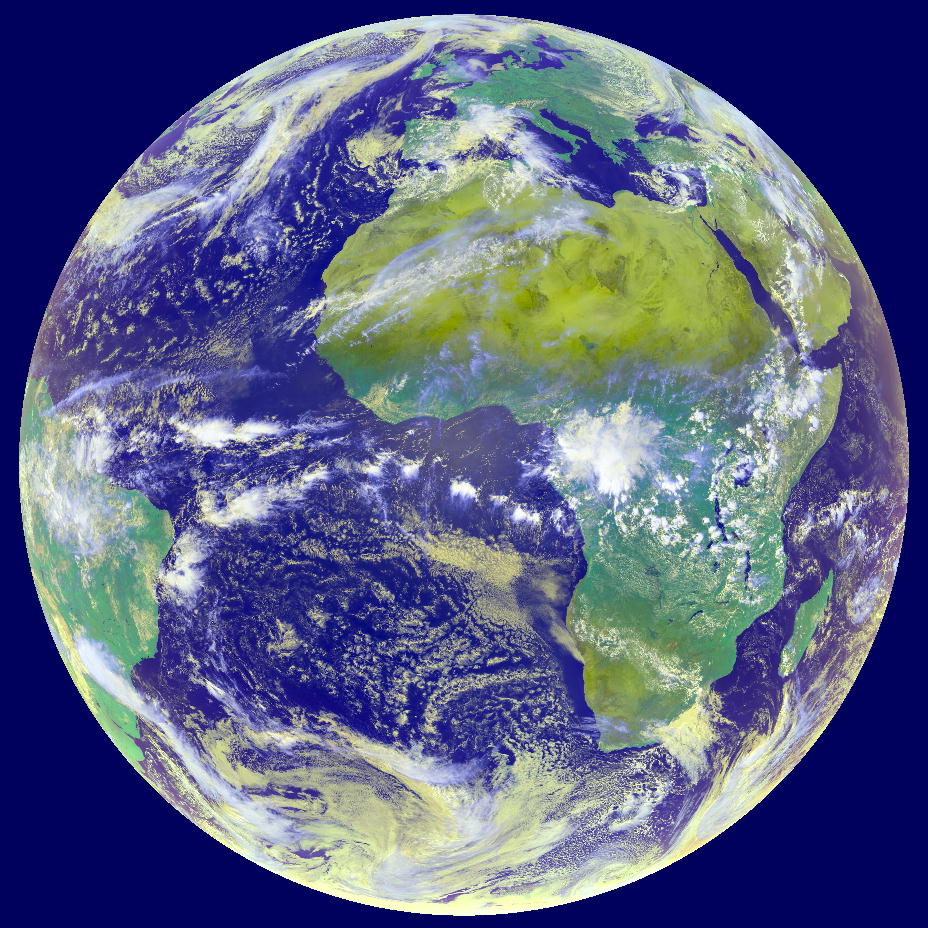
The following colour images (fig 1 to 3) show APOLLO products together with a composite of the SEVIRI channels at 0.6, 0.8 and 12 µm. This
is an example of a set of typical quicklook images of the APOLLO/SEV (APOLLO applied to SEVIRI data) cloud products at daytime. The daytime scheme uses only pixels with enough sunlight
to derive optical cloud parameters. In the quicklook images all pixels with not enough sunlight (dark pixels) or space pixels are masked. In
the product images, those pixels are masked in red. The example SEVIRI scene is from January 23rd, 2004, 11:00 UTC.
 |
 |
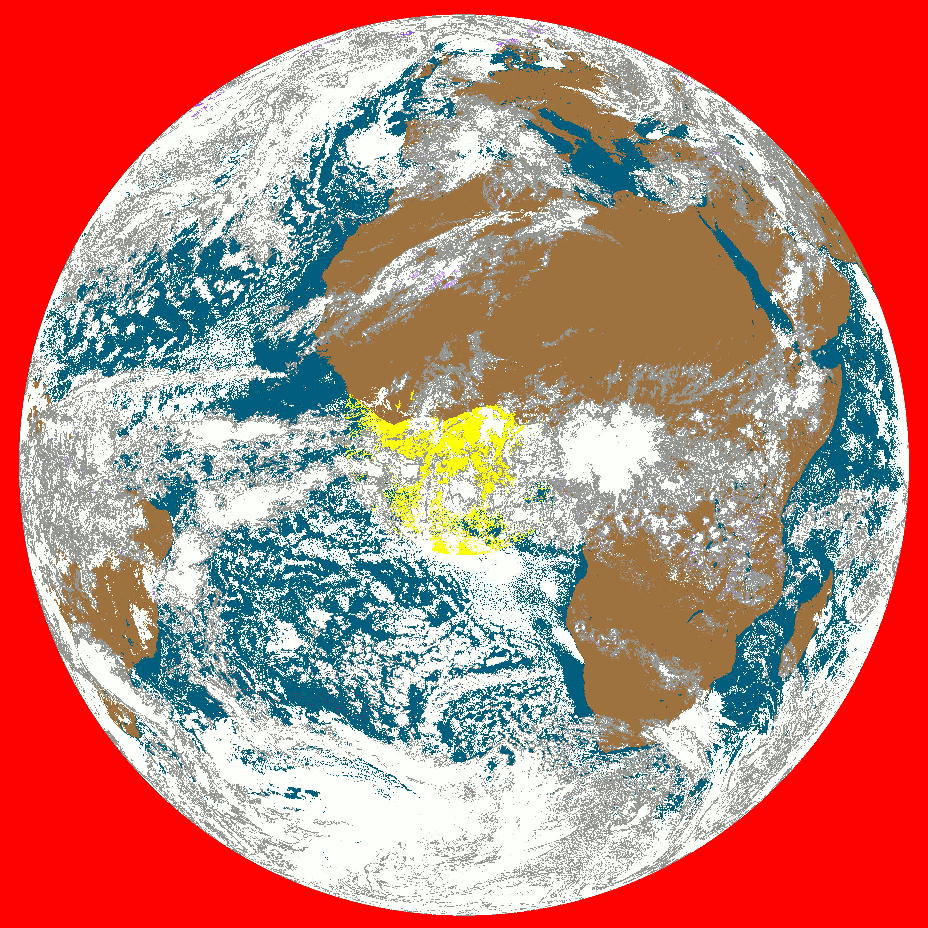 |
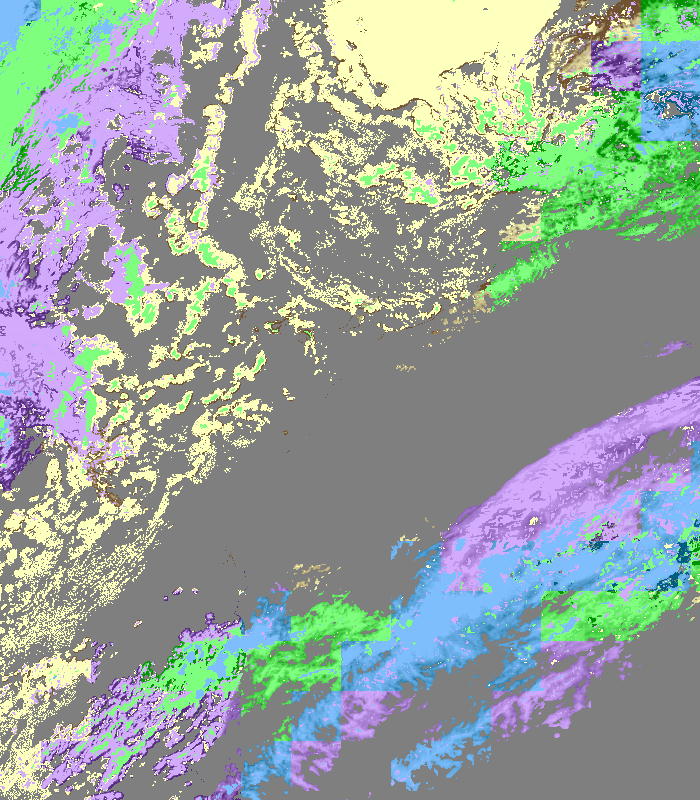
Fig. 1: APOLLO colour composite and (cloud) classification mask for January 23rd, 2004, 11:00 UTC. Please click on color bar to enlarge.
© EUMETSAT/DLR
The lower image in Fig. 1 is the typical quicklook of an extract of the APOLLO/SEV cloud-mask. The original APOLLO/SEV cloud-mask contains the information of all applied cloud detection algorithms. In this quicklook, the colud-mask content is reduced to an overall cloud/snow/ice-information without details on the algorithms combined with a land/sea/sunglint-information from another APOLLO/SEV mask.
| |
 |
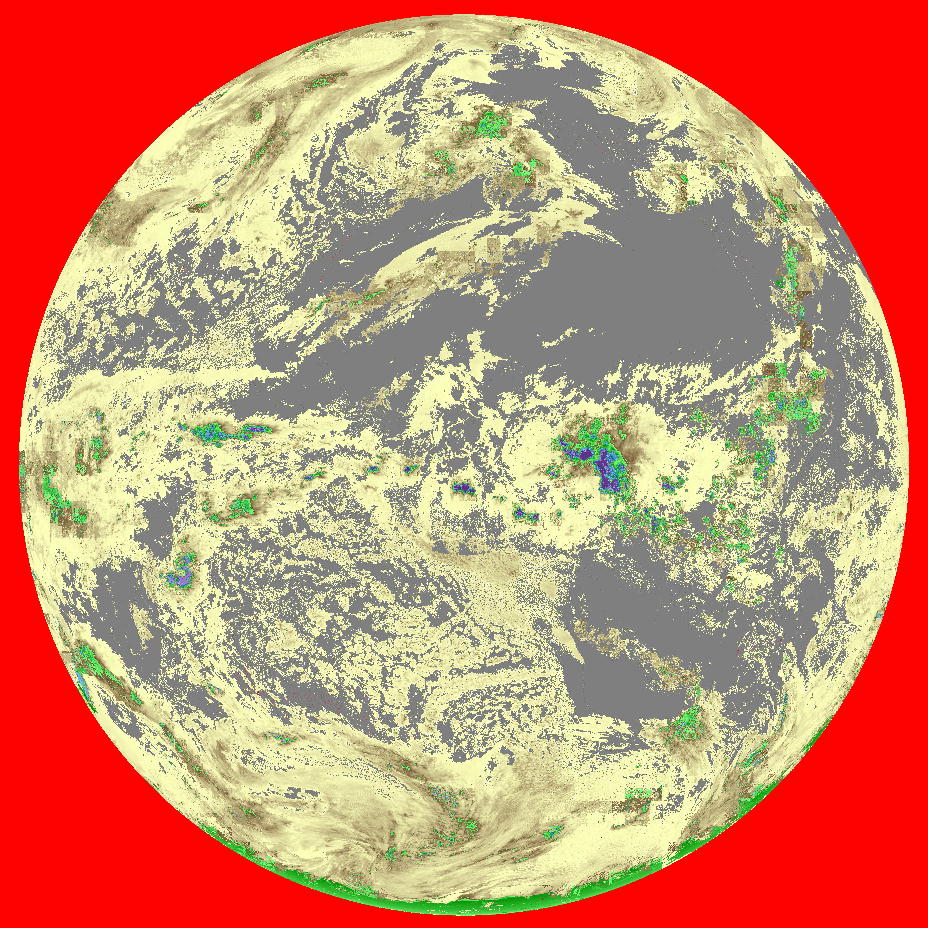 |
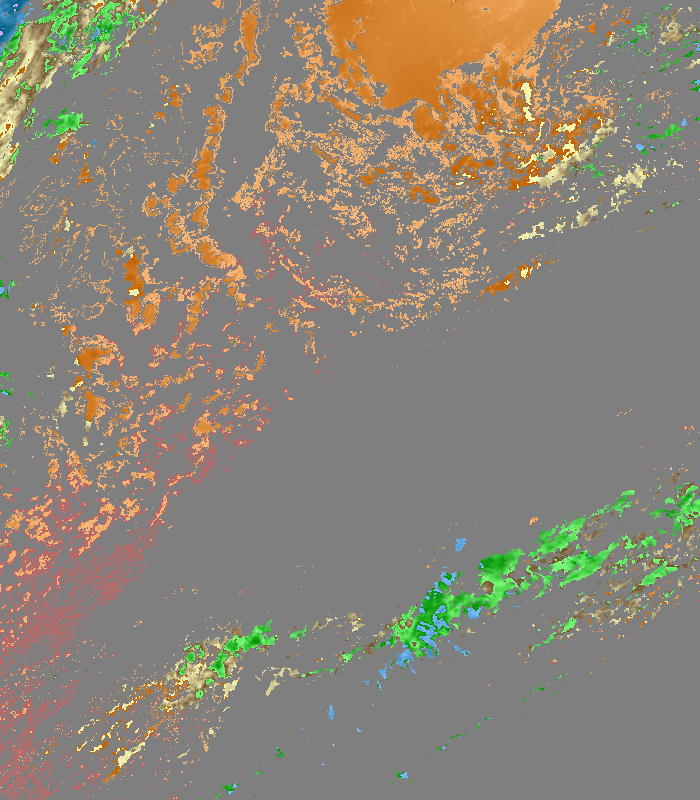
Fig. 2: APOLLO colour composite and cloud optical thickness for 23. January 2004, 11:00 UTC. Please click on color bar to enlarge.
© EUMETSAT/DLR
In APOLLO/SEV the values of the cloud optical depth can range from 0.5 to 500. Optical depths lower 0.5 are more typical for aerosols than for clouds and therefore not displayed in the lower image (Fig. 2). The highest values are associated with the highest water path values and the lowest cloud top temperatures over Central Africa.
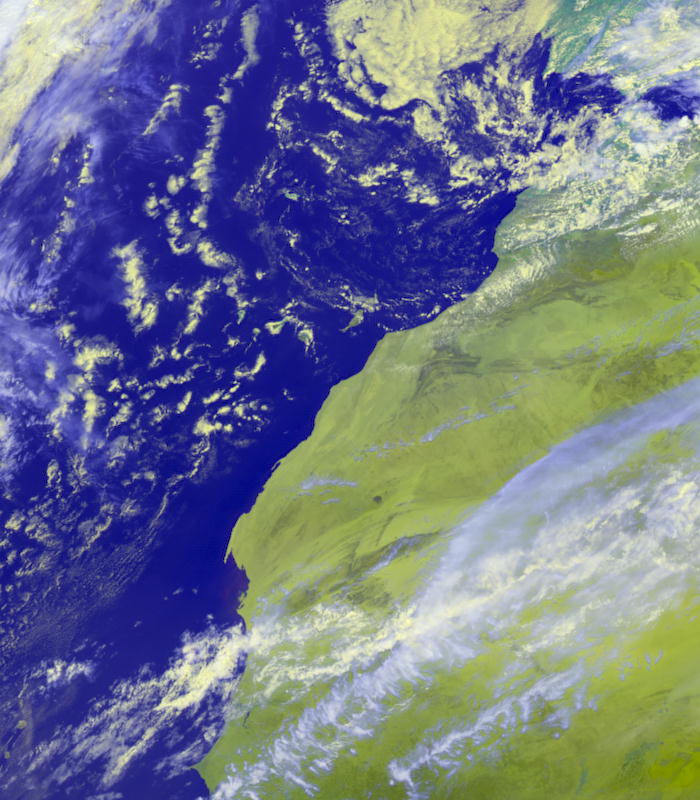
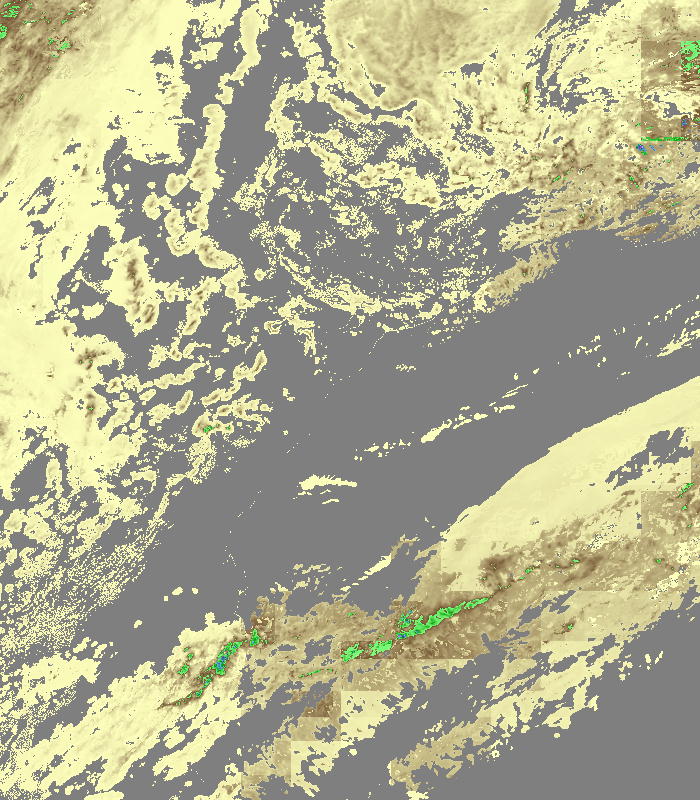
The four images below (Fig. 3) show a subset in higher resolution around the Canary Islands. Besides the composite (upper-left) the cloud coverage (upper-right), cloud top temperature (lower-left) and cloud optical depth (lower-right) are displayed.
 |
|
|
|
Fig. 3: Subset in higher resolution around the Canary
Islands (January 23rd, 2004):
Composite (upper-left), cloud coverage(upper-right),
cloud top temperature (lower-left) and cloud optical depth (lower-right). Please click on color bar to enlarge.
© EUMETSAT/DLR
The AVHRR Processing scheme Over cLouds Land and Ocean (APOLLO) was the
first AVHRR data processing scheme to make use of all five spectral channels
during daytime. It was adapted to Meteosat Second Generation (MSG) SEVIRI
data.
It discretises all pixels into four different groups called cloud-free,
fully cloudy, partially cloudy (i.e. neither cloud-free nor fully cloudy)
and snow/ice-contaminated, before deriving physical properties (Saunders
and Kriebel 1988, Kriebel et al. 1989, Gesell 1989, Kriebel et al, 2003).
Within APOLLO, clouds are categorised into three layers according to their
top temperature. The layer boundaries are set to 700 hPa and 400 hPa.
The associated temperatures are derived from standard atmospheres. Further,
each fully cloudy pixel is checked to see whether it is thick or thin
cloud, depending on its 11 µm and 12 µm brightness temperatures and, during
daytime, its channel 0.6 µm and 0.8 µm reflectances. Thin clouds (with
no thick clouds underneath) are taken as ice clouds, i.e. cirrus, whereas
thick clouds are treated as water clouds.
Cloud cover is derived for each cloud type separately, which is trivial
for the fully cloudy (100%) and the cloud-free pixels. To derive the fractional
cloud cover of the partially cloudy pixels at daytime, the relationship
of the measured 0.6 µm and 0.8µm reflectances to the mean of the fully
cloudy and cloud-free reflectances in a local neighbourhood (e.g. 50 by
50 pixels) is used. At night-time the relationship of measured to local
mean cloud-free and fully cloudy 10.8 µm radiances is used. More details
of these methods can be found in Saunders and Kriebel (1988).
At daytime, for each fully cloudy pixel, clouds optical depth, liquid/ice
water path and IR-emissivity are derived by means of parameterisation
schemes using the reflectance at 0.6 µm, i.e. which does not depend on
and is not influenced by water vapour absorption above ~ 0.75 µm. The
parameterisation scheme is based on the directional hemispherical cloud
top reflectance, which is obtained from the (measured) bi-directional
top of atmosphere reflectance by applying an anisotropy correction, correction
due to ozone absorption and subtracting the surface part of the reflectance
transmitted through the cloud. Details of the method can be found in Kriebel
et al. (1989).
At daytime, as well as at night-time, for each fully cloudy pixel excluding
thin clouds, the cloud top temperature is obtained by means of a correction
for the water vapour absorption above the cloud and for the (attenuated)
surface radiance through the cloud. The detailed description of the method
can be found in Saunders (1988).
These four products can also be obtained as weighted averages for local
(e.g. 10x10) pixel boxes compatible with model grid values.
The adaptation of APOLLO to MSG-SEVIRI comprises the following changes:
- The defaults of the thresholds for most of the APOLLO algorithms have to be set depending on the region covered by the data to be processed. The thresholds itself are either set explicitly or are dynamically derived from local histogram calculations in neighbourhood-boxes. Therefore, all explicitly set thresholds and all default settings have been changed, i.e. their values have been adapted to the regions visible by SEVIRI (especially necessary for non-European areas). These presets must be physically reasonable, i.e. are climatologically or empirically determined for the complete SEVIRI view and usually depend on the region and also the season. Therefore, all tables with presets are different between APOLLO/SEV and APOLLO/AVH (APOLLO applied to AVHRR data).
- Step 2 and 3 in the APOLLO processing contain corrections for regional peculiarities, e.g. cold currants and thermal fronts in the ocean, deserts with frequent sand storms etc. These local peculiarities can cause misclassifications and wrong values for the cloud parameters and the processing must correct for it. These corrections depend not just on the region with the certain peculiarity but also on the degree of experience with it. Therefore, each APOLLO processing scheme is specific for the region it is applied to and APOLLO/SEV and APOLLO/AVH differ here as much as the AVHRR-view (covering mainly Europe due to field-of-view of DLR's receiving system at Oberpfaffenhofen) and SEVIRI-view are different.
- A check if results of APOLLO/SEV are reasonable has been done by means of comparisons of typical cloud parameter values derived from both, SEVIRI and AVHRR, and by means of a quality analysis based on many years of experiences with APOLLO/AVH.
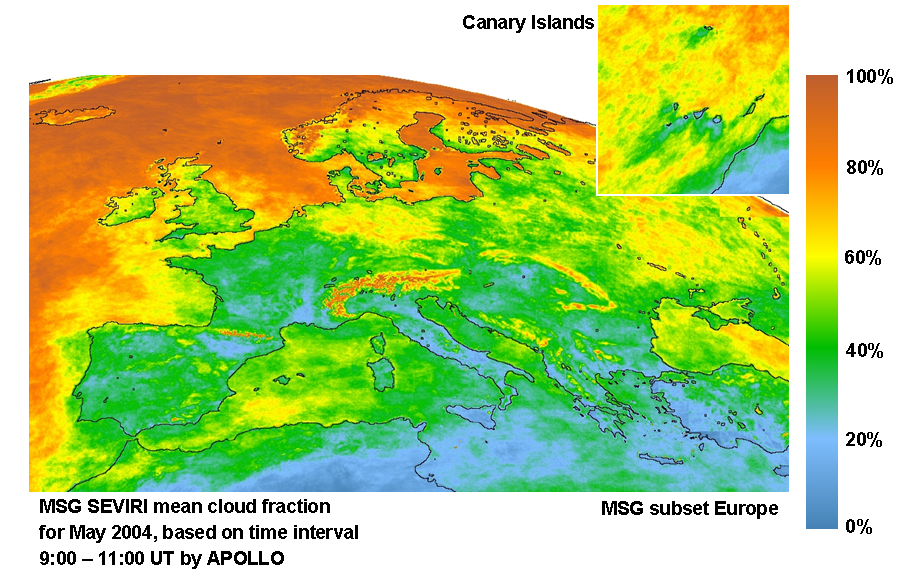
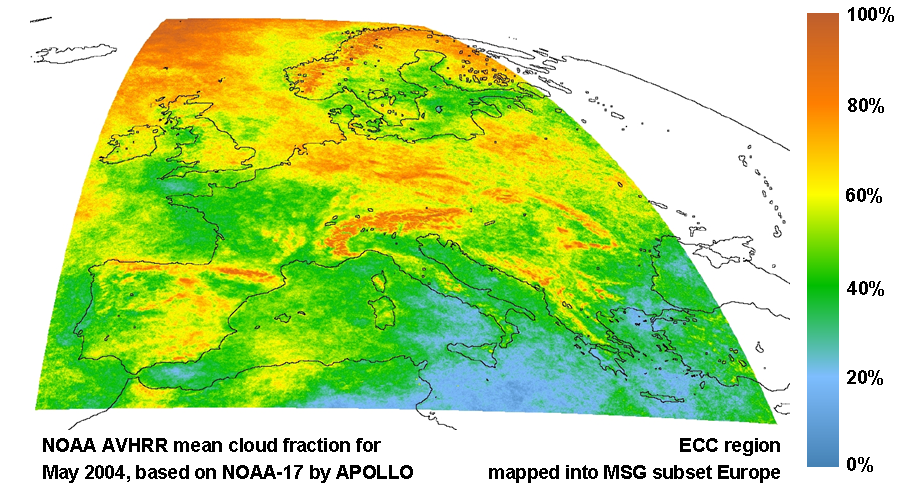
May 2004 has been chosen as epoch to compare SEVIRI-based with AVHRR-based monthly mean cloud fractions. The SEVIRI-based monthly mean cloud fractions have been computed from a collection of 245 full disk individual scenes in the time interval 9:00 – 11:00 UT. The time interval has been chosen to fit the morning overpass time range of NOAA-17. The AVHRR-based monthly mean cloud fractions have been computed from 78 individual NOAA-17 AVHRR scenes for covering the region of the "European Cloud Climatology" ECC, a DLR long-term data set of cloud parameters from AVHRR using APOLLO.
A comparison between cloud fractions from SEVIRI and from AVHRR both computed by the same methodology, APOLLO, can be done in various ways. Here, the most suitable comparison to find out the major differences using different data sources should be to look at mean values instead of individual scenes. For the region of the European Cloud Climatology ECC (34 N to 72 N, 11 W to 32 E) (Meerkötter et al, 2004) the comparison has been carried out on the basis of the mean cloud cover for May 2004. Since the AVHRR mean cloud cover has been composed of NOAA-17 morning data between 9:00 and 11:00 UT, the SEVIRI scenes from this time interval have been used to create the SEVIRI mean cloud cover. Actually the monthly mean cloud cover from AVHRR data is provided in the ECC map which is a rectangular projection with equidistant latitude-longitude grid. It has been remapped to the MSG projection for the comparison. To display the main results the mean cloud fractions are presented in the following for the full disk and for a European subset, together with the differences of the mean cloud fractions and some 2-dimensional histograms.
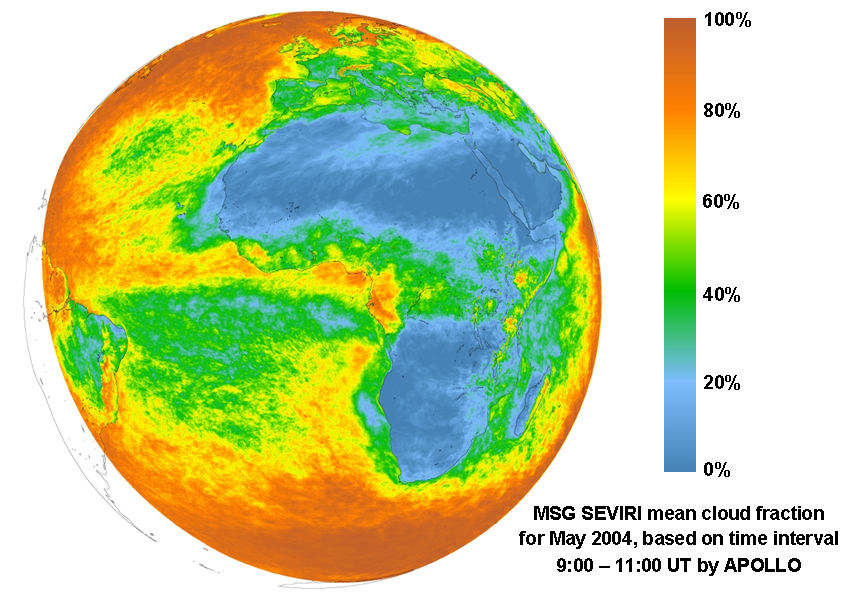
Fig. 4: Full disk monthly mean cloud cover derived from SEVIRI data by APOLLO (click to enlarge).
Figure 4 shows the full MSG disk monthly mean cloud fractions derived with APOLLO from SEVIRI scenes. The cloud cover is only displayed where it is composed of at least 100 values from 245 available individual scenes. The large scale global distribution of the cloud cover is represented clearly with low values along the Subtropics, the lowest values over the desert areas in Africa and around the Arabian Peninsula and the higher values in the Tropics and Mid-latitudes. Also some medium and small scale features caused by the Trade Winds can be seen, e.g. the lee-side effects south-east off the Canary Islands, the low cloud cover west off the African coast where dry air from the Sahara permanently suppresses the development of clouds, and the windward side orographic cloud cover over the south-east of Madagascar. The increased cloud cover over mountainous regions, e.g. the Alps, is partly caused by convective clouds which frequently appear over mountains in summer. On the other hand it can also be caused by snow pixels erroneously detected as clouds. Also this image shows that the cloud cover tends to increase systematically to the edge of the MSG disk due to slant-viewing effects. One should take into account that the satellite zenith angles for SEVIRI can reach more than 80º but for AVHRR they range only up to 69º. One outcome of this comparison is that cloud fractions from SEVIRI should be treated the more carefully the closer the edge of the disk is or even should be restricted to satellite zenith angles up to 69º at the maximum. This corresponds to about 61º latitude (at 0º longitude). Nevertheless in this study all pixels have been taken into account for the statistics.
 |
|
| Fig. 5: SEVIRI monthly
mean cloud cover for the European subset (click to enlarge). |
|
 |
 |
| Fig. 6: AVHRR monthly mean cloud cover
for the ECC area mapped to the European subset (click to enlarge). |
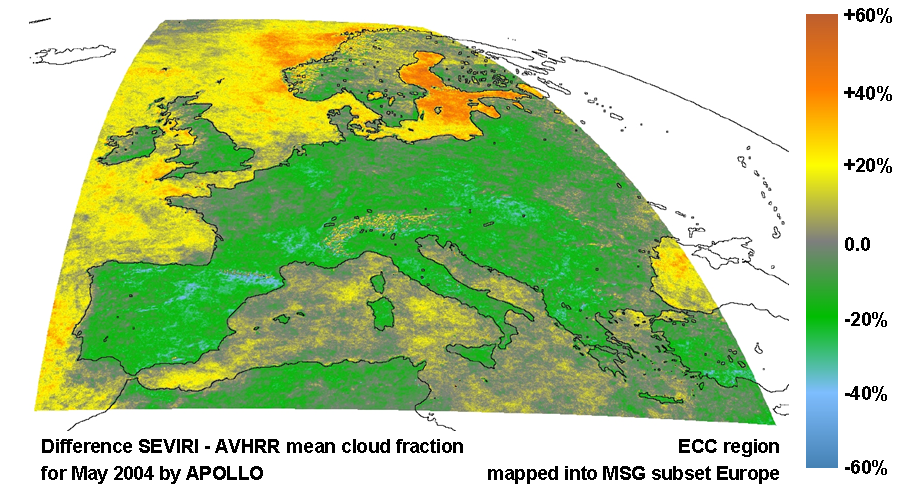
Fig. 7: Difference SEVIRI minus AVHRR
monthly mean cloud fractions (click to enlarge). |
Figure 5 and 6 show the monthly mean cloud cover from SEVIRI for the MSG European subset together with the region of the Canary Islands and from AVHRR for the ECC area mapped to the MSG European subset respectively.
The differences between SEVIRI and AVHRR monthly mean cloud fractions are shown in figure 7. The following conclusions can be made looking at the difference image:
- The SEVIRI-based cloud fractions tend to higher values over sea compared to the AVHRR-based. This effect obviously increases with increasing the MSG zenith angle.
- Over land the AVHRR-based cloud fractions tend to higher values compared to the SEVIRI-based, except over the Alps.
- Over the Mediterranean Sea and over large land areas the agreement is quite good.
- Over the Alps the common trend over land is broken. Instead, SEVIRI-based cloud fractions are largely higher than the AVHRR-based. This may result from the slightly different cloud-snow discrimination algorithm used for SEVIRI compared to AVHRR.
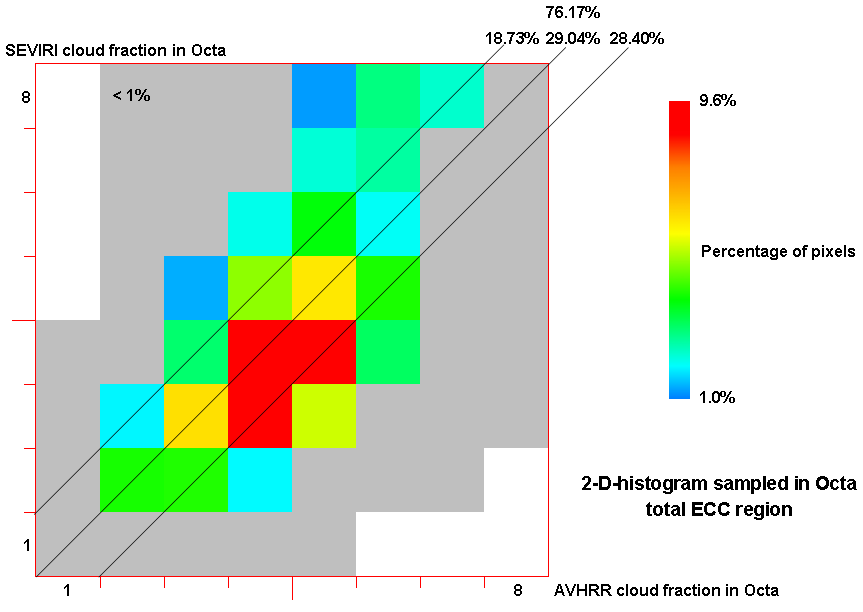
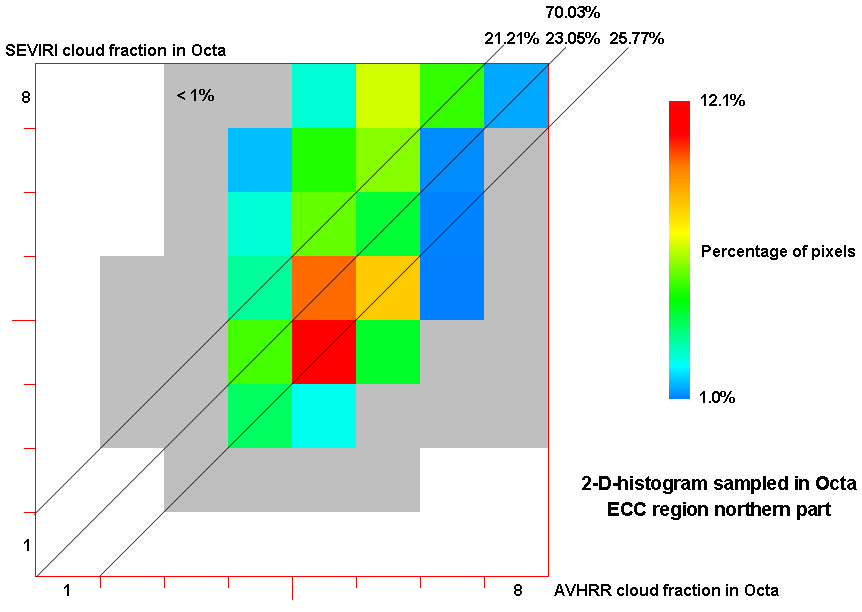
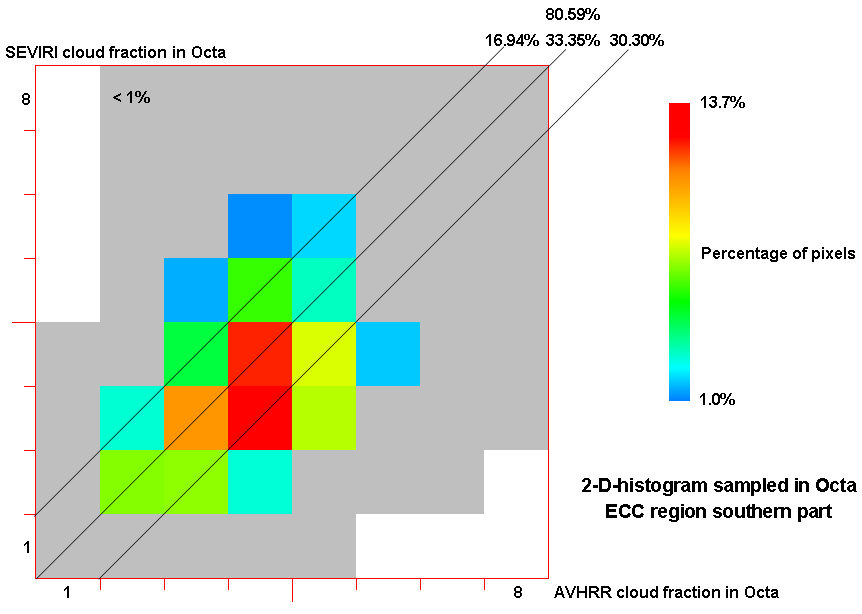
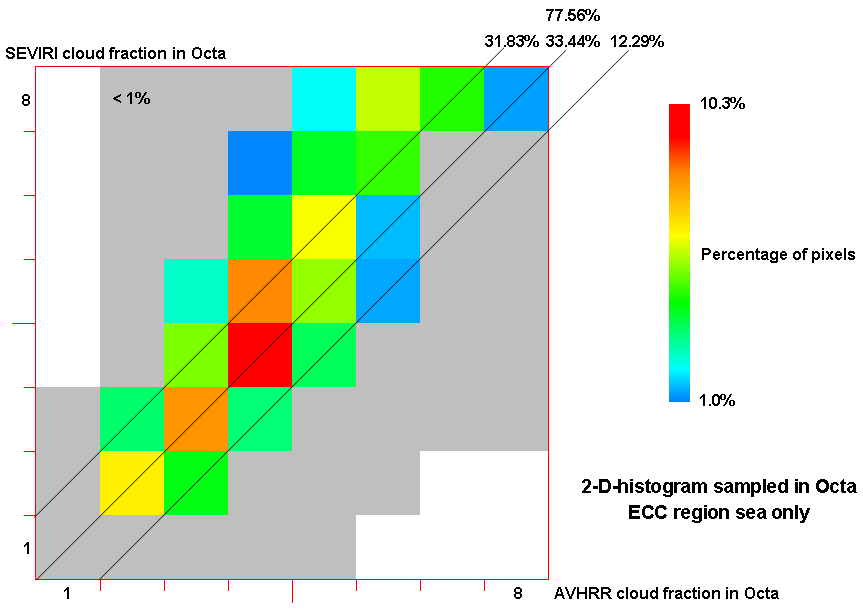
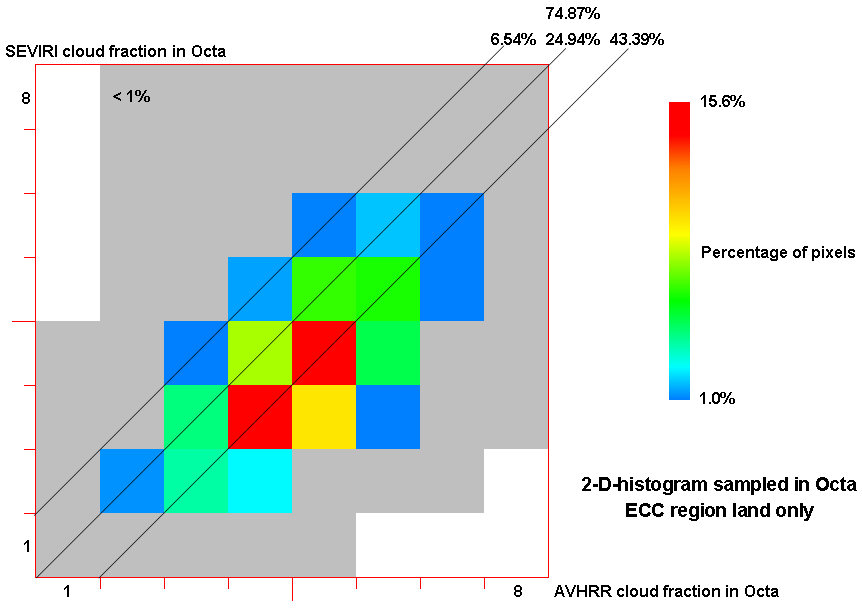
For a quantitative analysis a statistical comparison of the SEVIRI-based monthly mean cloud fractions with the AVHRR-based has been done using 2-dimensional histograms. 2-d-histograms have been calculated for the total ECC area, for the northern and the southern half, and for sea respectively land only. This means that either all pixels of the ECC area count for the histogram or only the pixels of the northern/southern part or only sea/land pixels respectively. Such histograms put all value combinations into suitably predefined classes and provide statistical quantities of the resulting distribution. Since we deal with cloud fractions and for a later comparison with ground-based observations so-called Octa-classes have been chosen. This means that cloud fraction combinations have been sampled to boxes with the size of 12.5% by 12.5%. The figures 8-12 show the 2-d-histograms where the SEVIRI-based fractions are assigned to the y-axis and the AVHRR-based to the x-axis for five different regions or surface types. Boxes with no values are plotted in white. Boxes with less than 1% population, compared to the total number of pixels counting for the histogram, are plotted in grey. Boxes with at least 1% population are plotted in colours from blue over green, yellow and orange to red. The red colour indicates the boxes with the maximum population which varies depending on the distribution. The maximum occurring population is given together with the colour scale. Additionally the total populations of all Octa-boxes along the main as well as along the +1-Octa and -1-Octa diagonals are given. The total population of all these three diagonals (percentage above the percentages of the single diagonals) varies between about 70% and 80%, i.e. 70% - 80% of all pixels show differences with ±1 Octa. This result is comparable to the result of the comparison of APOLLO/AVHRR cloud fractions with ground observations (synoptic data) (Kriebel et al, 2003).
 |
 |
 |
| Fig. 8: 2-d-histogram for the total
ECC area (click to enlarge) |
Fig. 9: 2-d-histogram for the northern part of the ECC region (click to enlarge). | Fig. 10: 2-d-histogram for the southern part of the ECC region (click to enlarge). |
 |
 |
|
| Fig. 11: 2-d-histogram for sea pixel in the ECC region only (click to enlarge). | Fig. 12: 2-d-histogram for land pixel in the ECC region only (click to enlarge). |
Users, fields of relevance and communities:
Data access:
A major reprocessing is currently ongoing starting from February 2004 to today. Data is available on request.
Quicklook access:
Monthly animated gif formatted quicklooks (in reduced 928x928 pixel resolution) based on 1200 UTC images
of color composites (comp), cloud masks (mask) and cloud optical depth (odp) can
be found here.
Daily animated gif formatted quicklooks (in reduced 928x928 pixel resolution) based on all MSG images between 0200
and 2200 UTC in 15 min temporal resolution can be found here.
For questions and more information please contact the SEVIRI team at DLR
Gesell, G., 1989: An Algorithm for Snow and Ice Detection Using AVHRR Data: An Extension to the APOLLO Software Package. International Journal of Remote Sensing, Vol. 10, Nos. 4 and 5, pp. 897-905
Kriebel, K.T., R.W. Saunders and G. Gesell, 1989: Optical Properties of Clouds Derived from Fully Cloudy AVHRR Pixels. Beiträge zur Physik der Atmosphäre, Vol. 62, No. 3, pp. 165-171, August 1989
Kriebel K. T., Gesell G., Kästner M., Mannstein H., The cloud analysis tool APOLLO: Improvements and Validation, Int. J. Rem. Sens., 24, 2389-2408, 2003
Meerkötter R., C. König, P. Bissolli, G. Gesell and H. Mannstein, 2004, A 14-year European Cloud Climatology from NOAA/AVHRR data in comparison to surface observations, Geophysical Research Letters, Vol. 31, L15103, doi:10.1029/2004GL020098
Saunders, R.W. and K.T. Kriebel, 1988: An improved method for detecting clear sky and cloudy radiances from AVHRR data. International Journal of Remote Sensing, 9, 123-150
Saunders, R.W., 1988: Cloud top temperature/height: A high resolution imagery product from AVHRR data, Meteorological Magazine, Vol 117, pp 211-221